Bitcoin Bulls Encounter Headwinds as Monthly Stochastic Indicator Trends Downward: Analyst
Bitcoin's Most Oversold Levels Since Covid Crash Indicated by Key Metrics
Bitcoin and U.S. Real Yields Forge Strongest Inverse Link Since April
Bitcoin's price has been in the red for three days straight, but technical indicators point to a potential short-term price increase.
Bitcoin (BTC) has pulled back 9% since crossing the significant $30,000 threshold on April 14th, while Ether (ETH) has dipped by 14% since topping out above $2,100 over the same period.
From a technical perspective, a few noteworthy observations can be made:
- The $30,000 level presents a clear resistance for Bitcoin and Ether. Generally, support or resistance for these cryptocurrencies tends to cluster around round numbers, as traders frequently set buy and sell orders at price levels that end in 0 or 5.
- Bitcoin's ascent to $30,000 coincided with its Bollinger Bands reaching the upper limit of their range at that time.
- Bitcoin's trading range shrank to just 0.0005% between its opening and closing prices as it approached the upper limit of its range, indicating that both buyers and sellers were satisfied with its price.
Bollinger Bands depict an asset's 20-day moving average and measure two standard deviations above and below the average. Given that an asset's price is anticipated to remain within two standard deviations of the average 98% of the time, breaking either boundary is deemed a noteworthy event to monitor.
On this occasion, the breach coincided with a psychological resistance level, which is likely to have heightened investors' interest in what comes next.
The recent downturn was in line with an anticipated loss of momentum, and it coincided with a move towards the lower boundary of the Bollinger Band. The drop in momentum is reflected in Bitcoin's Relative Strength Index (RSI), which has declined from 71.54 to its current level of 42.53.
From January 2015 to present day, Bitcoin's RSI has remained within the 42 to 45 range on 163 occasions, with an average 30-day performance of 6% in the aftermath.
Historically, Bitcoin's performance over the next seven days has been stagnant, resulting in a meager gain of just 0.63%.
As Bitcoin nears the lower limit of its Bollinger Bands, the question arises as to whether prices will dip below this level or remain within the range of confidence and climb higher.
Based on recent trends, analysts using technical analysis may anticipate a gradual uptick in BTC prices, as they move towards their 20-day average. Currently, Bitcoin's 20-day moving average sits roughly 6% above its current price, presenting a moment of technical convergence.
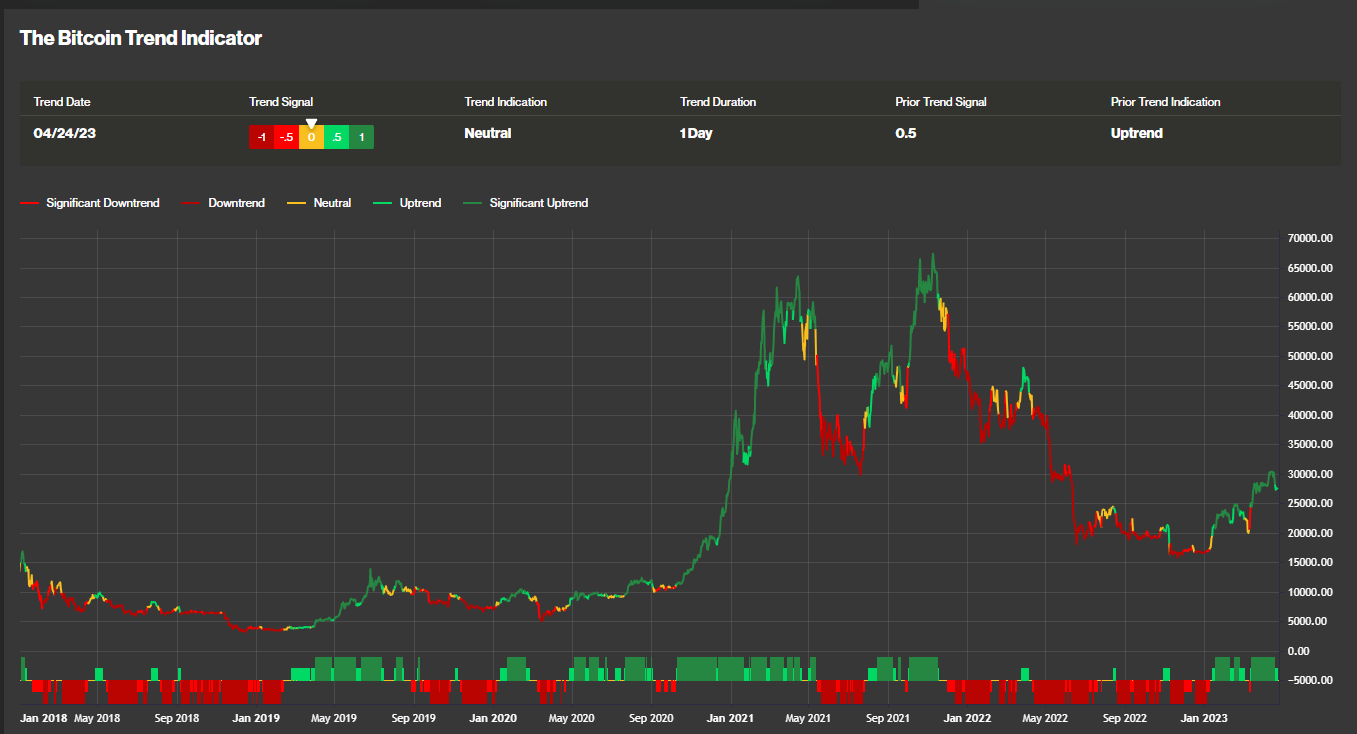
The CoinCryptoUS Bitcoin Trend Indicator has recently dropped from 0.5 (uptrend) to 0 (neutral), indicating a recent pause in Bitcoin's price movement.