
NounsDAO on the Brink of Treasury Division Split Amidst 'Rage Quit' Uprising by NFT Holders
MicroStrategy's Significant Bitcoin Impairment Losses May Mislead: Berenberg
Binance Supercharges Bitcoin and Ether Trading in Argentine, Brazilian, and South African Currencies with Exciting Fee Promotion
A popular bitcoin (BTC) technical analysis indicator, widely monitored, has recently turned bearish, causing some cryptocurrency enthusiasts on Twitter to voice their concerns about a potential prolonged decline in price.
The latest analysis from TradingView indicates that the moving average convergence divergence (MACD) histogram on the weekly chart of bitcoin price has experienced a significant downward crossover, dipping below the zero line. This crossover is widely recognized as a transition from a bullish sentiment to a bearish one, often interpreted as a signal to sell. Conversely, when the MACD histogram crosses above zero, it typically suggests a shift towards a bullish trend.
However, according to certain technical analysts, the significance of the signal is diminished by other factors. The performance of the bitcoin price will also be influenced by macroeconomic events like the release of the U.S. inflation figure today and the Federal Reserve's decision on Wednesday. Despite this, the signal arrives after BTC experienced a 16% decline from its previous high of approximately $31,000, which occurred two months ago. This decline raises concerns about the long-term viability of the bullish resurgence witnessed earlier this year.
On Monday, pseudonymous crypto trader @CryptoBullet1 tweeted, referring to individuals who had anticipated a rapid and significant rally, as "Moonboys in disbelief,"
As per @CryptoBullet1, the current MACD bear cross bears resemblance to a similar occurrence approximately four years ago. During that period, the market had just experienced a remarkable rally, much like the one witnessed in the past two months, only to subsequently plummet following the bearish signal from the indicator.
#Bitcoin $BTC 1W 2019 v 2023 comparison
Same Echo Bubble.
Same Breakout Candle.
Same 147 days of uptrend until MACD crossed bearish.
Probably nothing pic.twitter.com/hIidC8iYfo
- CryptoBullet (@CryptoBullet1) June 12, 2023
The market also experienced distress during the bearish crossovers in April 2022, November 2021, and April 2021.
"That's why I believe the most probable outcome is we go to $19K-$20K," one Twitter user said, noting the MACD's record of predicting extended market swoons.
Key support intact
Katie Stockton, the visionary behind Fairlead Strategies and its technical analysis research, holds a contrasting viewpoint.
"A new weekly MACD 'sell' signal is a potential setback, but short-term oversold conditions are in place and intermediate-term oversold conditions are in reach, which gives bitcoin a better chance of holding up near support [at $25,200]," Stockton said in a note to clients on Monday.
Bitcoin remains resilient, steadfastly holding onto the support-turned-resistance level of $25,200 in the face of regulatory uncertainties and a wave of panic selling that has engulfed the realm of alternative cryptocurrencies. March witnessed an impressive breakthrough, as Bitcoin soared past this pivotal mark, signaling a powerful resurgence of bullish sentiment.
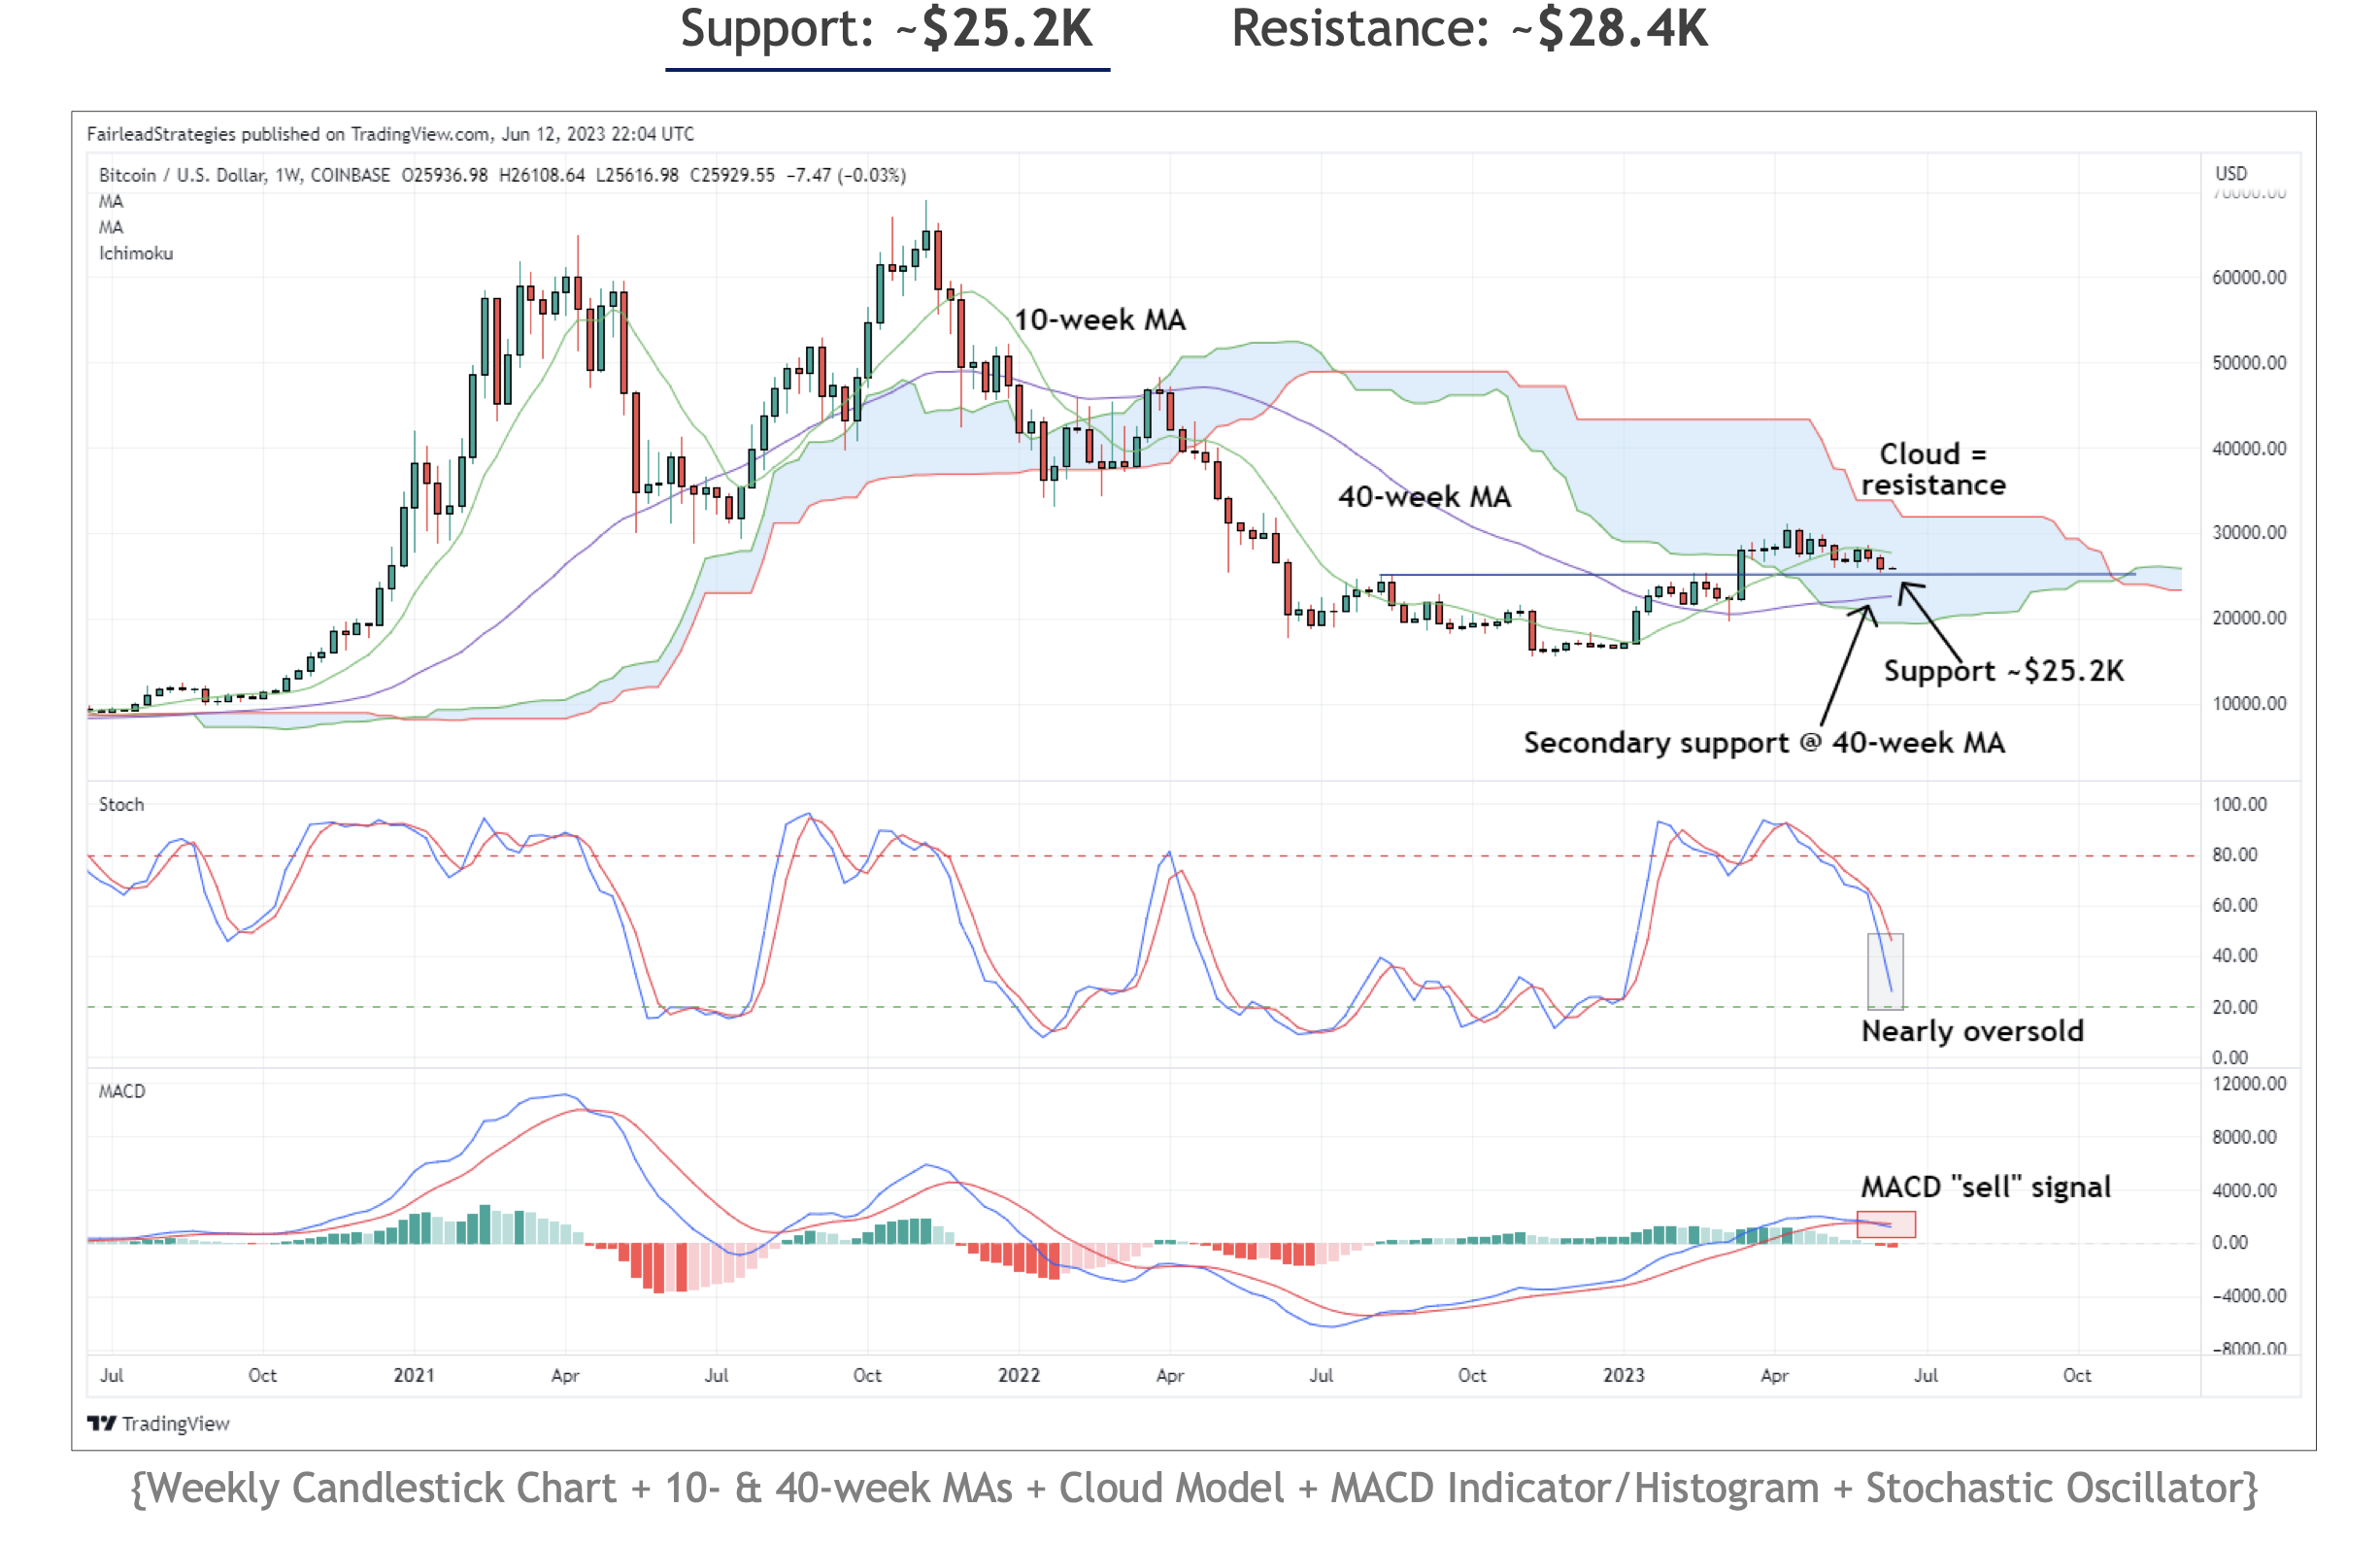
Bitcoin continues to hold support at $25,200 despite MACD's bearish flip. (Fairlead Strategies) (Fairlead Strategies/TradingView)
In the weekly chart, Bitcoin is demonstrating resilience at the $25,200 support level, as indicated by the horizontal line. The stochastic indicator is also indicating a potential oversold condition, with a reading just below 20.
While oversold signals alone may not be entirely reliable, when combined with prices trading at critical support levels, as is the case with BTC, they frequently indicate a resurgence of buying interest.
Focus on macro data
Furthermore, the release of the U.S. consumer price index (CPI) on Tuesday and the Federal Reserve's interest rate decision on Wednesday have the potential to significantly impact price charts.
Based on Bloomberg estimates, the upcoming release of May's consumer price index (CPI) is anticipated to reveal a 0.2% increase in the cost of living compared to the previous month, and a 4.1% rise from the previous year, indicating a slowdown from April's 4.9% annual growth. The core inflation, which excludes the volatile food and energy sectors, is projected to have risen by 0.4% on a monthly basis and 5.2% on an annual basis.
David Brickell, director of institutional sales at crypto liquidity network Paradigm, suggests that the prevailing bias for Bitcoin is leaning towards the upside.
"We've digested a lot of bad news in the past couple of weeks, including a reprice of higher rates and the U.S. dollar since April. Risk/reward for a move back to top of the range [is attractive]," Brickell tweeted. "I also think likely CPI [might] undershoot and markets [are] behind on how quickly inflation falls from here."
If the Consumer Price Index (CPI) were to decline at a faster rate, it would create an opportunity for the Federal Reserve to reduce interest rates. Since March 2022, the central bank has increased rates by 500 basis points, leading to instability in risk assets such as cryptocurrencies.


